Where does the power go in an ESP32-S3 with a tiny AMOLED display?
A few weeks ago I posted on socials about a tiny custom hardware project I’d done to monitor the quota of my AI subscriptions.
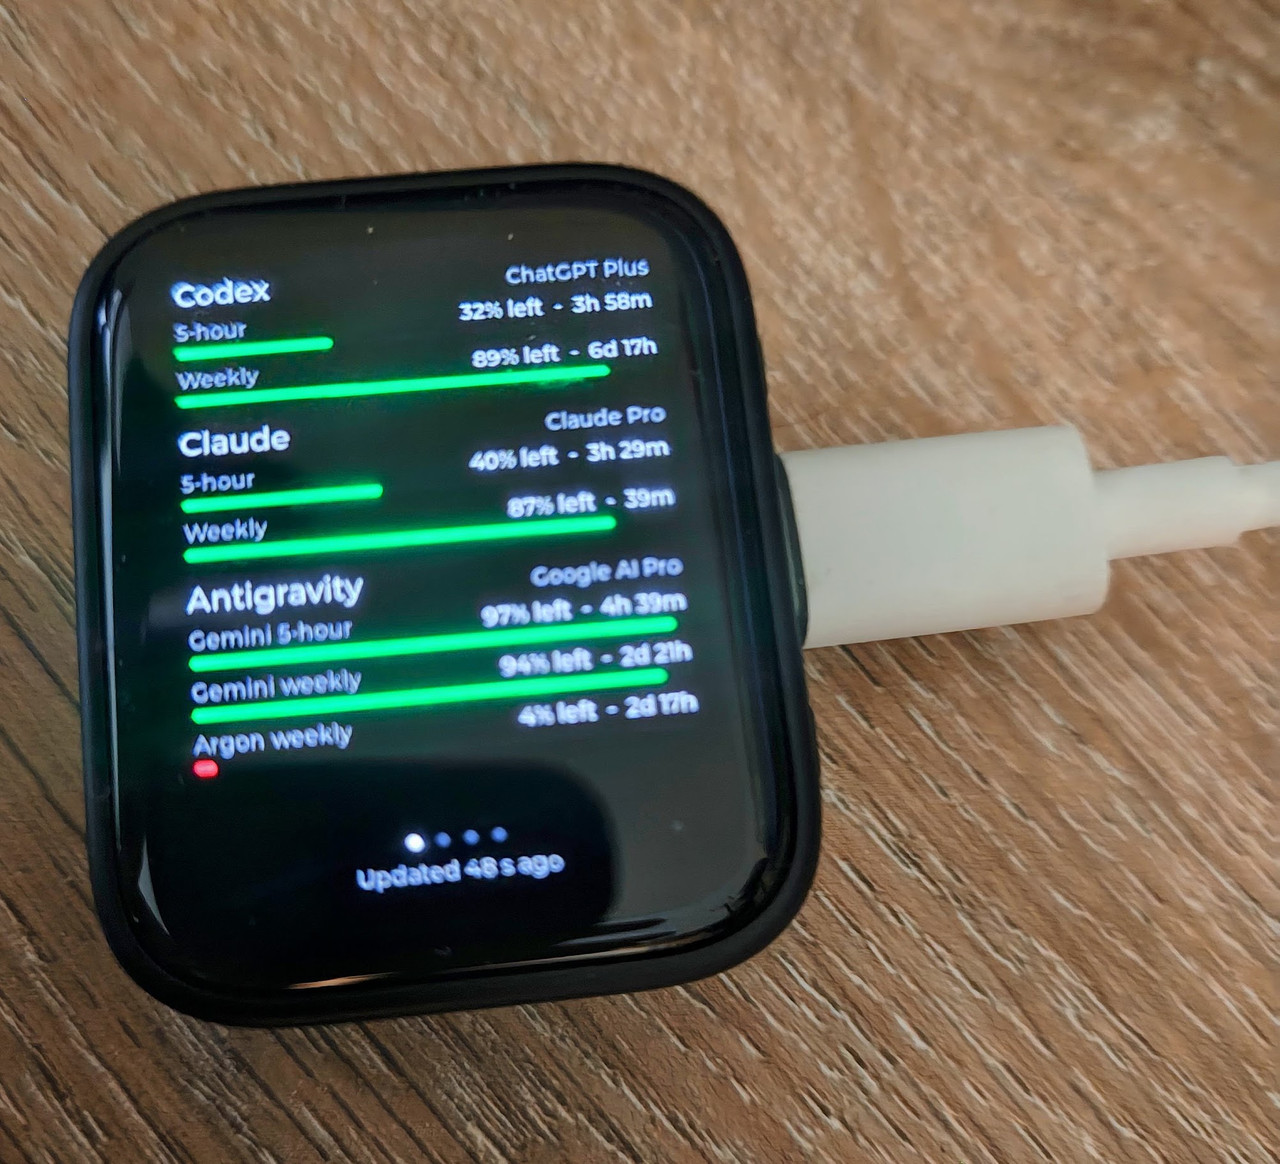
Since that post got decent traction, I decided to write up more on recent experiments around minimizing the device’s power usage.
Click to expand and learn how this display came about
I pay for three $20/month AI subscriptions (ChatGPT, Claude, and Google AI Pro), and I use all of them to build things. Each of them has its own quotas (5-hour windows, weekly windows, and since recently a separate weekly bucket for Gemini 4 Argon), and they all reset at different times. Keeping track of that in my head was not working. 🤯😵💫I already use CodexBar to show the quotas of all these providers, but that requires an extra click. And then I realized I had a Waveshare ESP32-S3-Touch-AMOLED-1.8 board lying around that would be perfect as a separate display for these quotas.
So I had Claude build custom firmware for the tiny display. It gets the numbers from CodexBar, which runs on the Mac mini the USB cable goes to. The board fetches the numbers over CodexBar’s built-in HTTP server via Wi-Fi once a minute.
To be clear: I didn’t write a single line of the code. Claude wrote all of it, from the display driver setup to the UI. I described what I wanted, tried it on the device, and complained when something looked off. :)
This is what my AI quota display looks like:
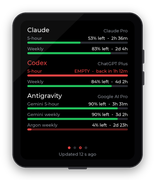
simulated rendering, since I was too lazy to take more pics
I’m usually on this main overview screen, but you can swipe left and right to get more details about one specific provider. The display really works for me, as it’s right in the corner of my eye as I’m working.
The board is switched on all day, plugged into a USB-C port on my Mac mini. So naturally, I got curious: how much power does a gadget like this actually use? And which parts of it are worth optimizing?
Claude’s first answer was an estimate, based on typical numbers for these parts: about 0.35W. That’s a nice number (about a dollar per year), but I wanted to know for sure. So I ordered a USB-C power meter (a FNIRSI FNB58, from AliExpress, so… patience) and hooked it up for some proper cable soup.
The setup
- The board is an ESP32-S3 at 240 MHz with 8 MB PSRAM, a 368 × 448 AMOLED display, capacitive touch, and a small battery.
- The UI is mostly black: white text, gray labels, and thin green/amber/red bars showing how much of each quota is left.
- The meter sits between the Mac mini and the board, and I read the values off its little screen by eye.
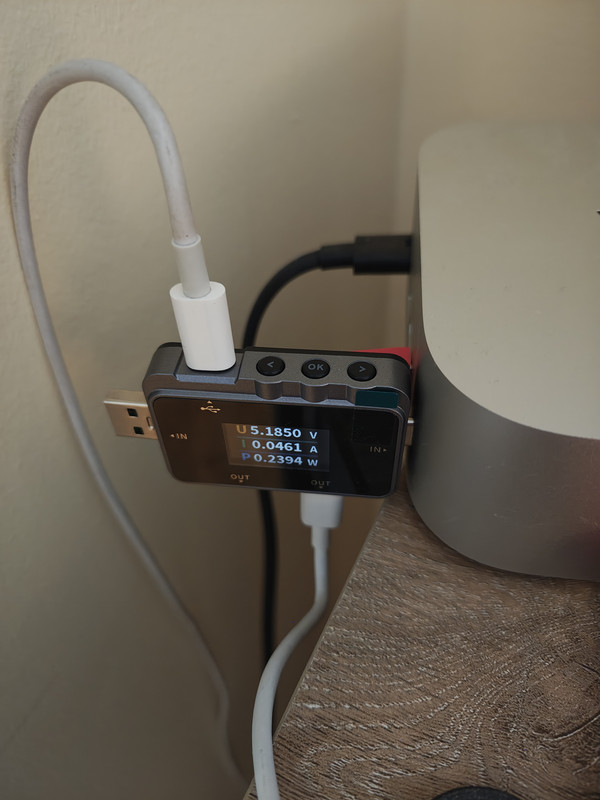
One “fun” surprise: with the meter in between, the Mac could no longer see the board as a USB device, so Claude couldn’t flash new firmware through it. The power goes through just fine, but the data apparently doesn’t1. So every firmware change meant swapping the meter out, flashing, and swapping it back in.
The test
To match each reading to a known state, Claude wrote a special version of the firmware that cycles through eight states, one minute each, and shows the current step on the screen:
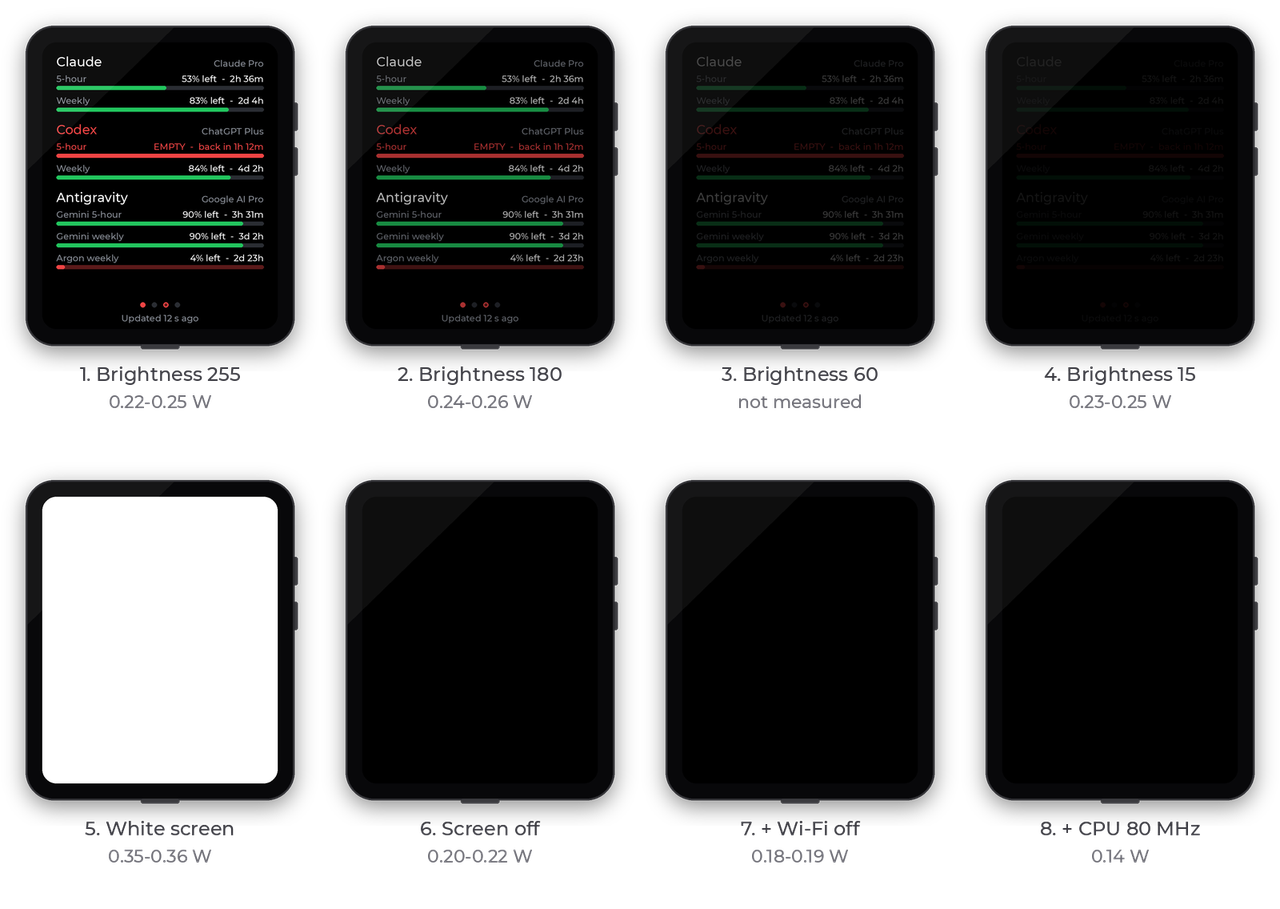
The eight steps (again simulated)
The voltage stayed at about 5.19 V, and these are the results for each step:
| Step | What’s on screen | Brightness | Wi-Fi | CPU | Power |
|---|---|---|---|---|---|
| 1 | Quota overview | 255 (max) | on | 240 MHz | 0.22–0.25W |
| 2 | Quota overview | 180 | on | 240 MHz | 0.24–0.26W |
| 3 | Quota overview | 60 | on | 240 MHz | not measured2 |
| 4 | Quota overview | 15 | on | 240 MHz | 0.23–0.25W |
| 5 | White screen | 180 | on | 240 MHz | 0.35–0.36W |
| 6 | Screen off | n/a | on | 240 MHz | 0.20–0.22W |
| 7 | Screen off | n/a | off | 240 MHz | 0.18–0.19W |
| 8 | Screen off | n/a | off | 80 MHz | 0.14W |
The first thing I noticed was that it uses less power than prediced. Based on the parts, Claude had predicted a power draw of 0.35W, but in reality the way I used the screen only drew 0.22W-0.25W. We’ll dig into that more below.
Second, whenever Wi-Fi was on, the meter also regularly jumped to 0.40–0.47W for a moment. More on those spikes below too.
What we learned
The bolded cells in the table are what stood out from the results:
-
On an AMOLED, the brightness barely matters for a dark UI.
Brightness 15 and brightness 255 draw the same power. That surprised me at first, but it makes sense: each pixel on an AMOLED makes its own light, and a black pixel is simply off. With a mostly black UI, there’s just not much to brighten.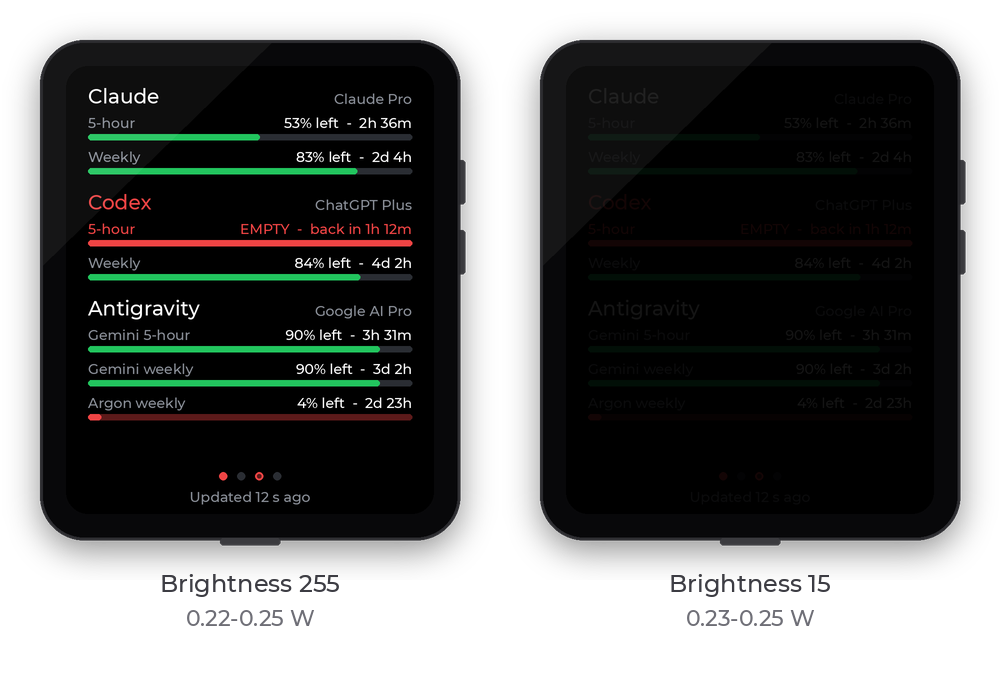
Very different brightness, the same power. -
Lit pixels are what costs power.
The white screen in step 5 added about 0.12W, which is roughly half again what the board usually uses. On an LCD, where the backlight lights the entire panel no matter what you show, the brightness setting would have mattered a lot more. So on an AMOLED display, dark mode matters (developers rejoice 🎉). -
Dimming is still useful, but for a different reason.
I mostly now use the brightness of the screen to draw attention. So the display dims when all bars are green (as that is a good state to be in), gets very dim at night (as I’m less likely to see it), and turns off when I haven’t used any AI for 30 minutes (no change in quota, means there’s nothing to see).3 -
Wi-Fi was cheaper than expected.
Claude had estimated Wi-Fi to be one of the bigger costs, and I even considered getting the data over the USB cable instead. But the ESP32’s built-in power saving already keeps the radio asleep most of the time: turning Wi-Fi off saved only ~0.02–0.0W. Not worth adding a helper process on the Mac for. -
The CPU clock was the biggest win.
A display like this spends nearly all its time waiting, but at 240 MHz it waits “expensively”. Dropping to 80 MHz (the lowest clock that still supports Wi-Fi) saved about 0.05W, a quarter of the total, with a single line of code:setCpuFrequencyMhz(80); -
The Wi-Fi radio causes power draw spikes.
Those spikes to ~0.4W turned out to happen several times per second, which confused me, since we only fetch data once a minute. It turns out that to stay connected, the radio wakes up for every “beacon” the router sends (typically every ~0.1 second) to check whether data is waiting for it.
Applying it
After all this measuring, we ended up with two changes to the firmware that Claude originally created for the display:
- The CPU now runs at 80 MHz.
Swiping between pages became noticeably slower, but not annoyingly so. - The Wi-Fi radio listens less often.
To reduce the power used by the Wi-Fi beacons, we tell the router that the board only listens every 10th beacon (so about once a second).:
In code:
WiFi.setSleep(WIFI_PS_MAX_MODEM);
wifi_config_t conf;
esp_wifi_get_config(WIFI_IF_STA, &conf);
conf.sta.listen_interval = 10;  // in beacons, ~0.1 s each
esp_wifi_set_config(WIFI_IF_STA, &conf);
And then I put the meter back in to check the results:
| Firmware | Screen | Steady draw | Spikes to ~0.4W |
|---|---|---|---|
| Original (240 MHz) | on | 0.24–0.26W | several per second |
| CPU at 80 MHz | on | 0.17–0.19W | several per second |
| + Wi-Fi listening every ~1 s | on | 0.18W | every 5–8 seconds |
| + Wi-Fi listening every ~1 s | off | 0.15–0.16W | every ~5 seconds |
So with the screen on, the display now uses about the same as the original firmware did with the screen off. And with the screen off, it’s within a hair of step 8 of the test (0.14W), where Wi-Fi was completely off. So staying connected to Wi-Fi now costs only about 0.01–0.02W.
Is it worth it?
Let’s be honest here:
| Average draw | Per year | Cost at $0.30/kWh | |
|---|---|---|---|
| Original firmware | ~0.21W | ~1.8 kWh | ~$0.55 |
| Optimized firmware | ~0.16W | ~1.4 kWh | ~$0.40 |
So I’m saving about 15 cents per year. :) The real benefit is when running from the battery, where lower power means proportionally longer runtime. But mostly, it was just fun to find out where the power goes.
Some caveats, since this was not exactly a lab setup:
- I read all values by eye from the meter’s display, in a single run, so there’s no logging or averaging.
- The meter measures everything coming in over USB, including any current that charges the board’s battery. The readings were stable, so the battery was likely full, but I didn’t verify that.
- The Wi-Fi spikes make the average hard to read by eye. The ranges above are the steady level between spikes.
Got feedback or questions? Sound off on socials with the links at the top of the article!
Footnotes
-
We tried flipping the meter’s USB-C plug, since some testers only wire the data lines for one orientation. No luck. If you know why an FNB58 would block USB data, let me know! ↩
-
I missed it. Given steps 1, 2 and 4, I’m pretty sure it’s in the same range. ↩
-
Yup indeed: the screen wakes up by itself when the quota numbers go up. The first time it lit up by itself when my agents started working again, I thought that was so cool. ↩
